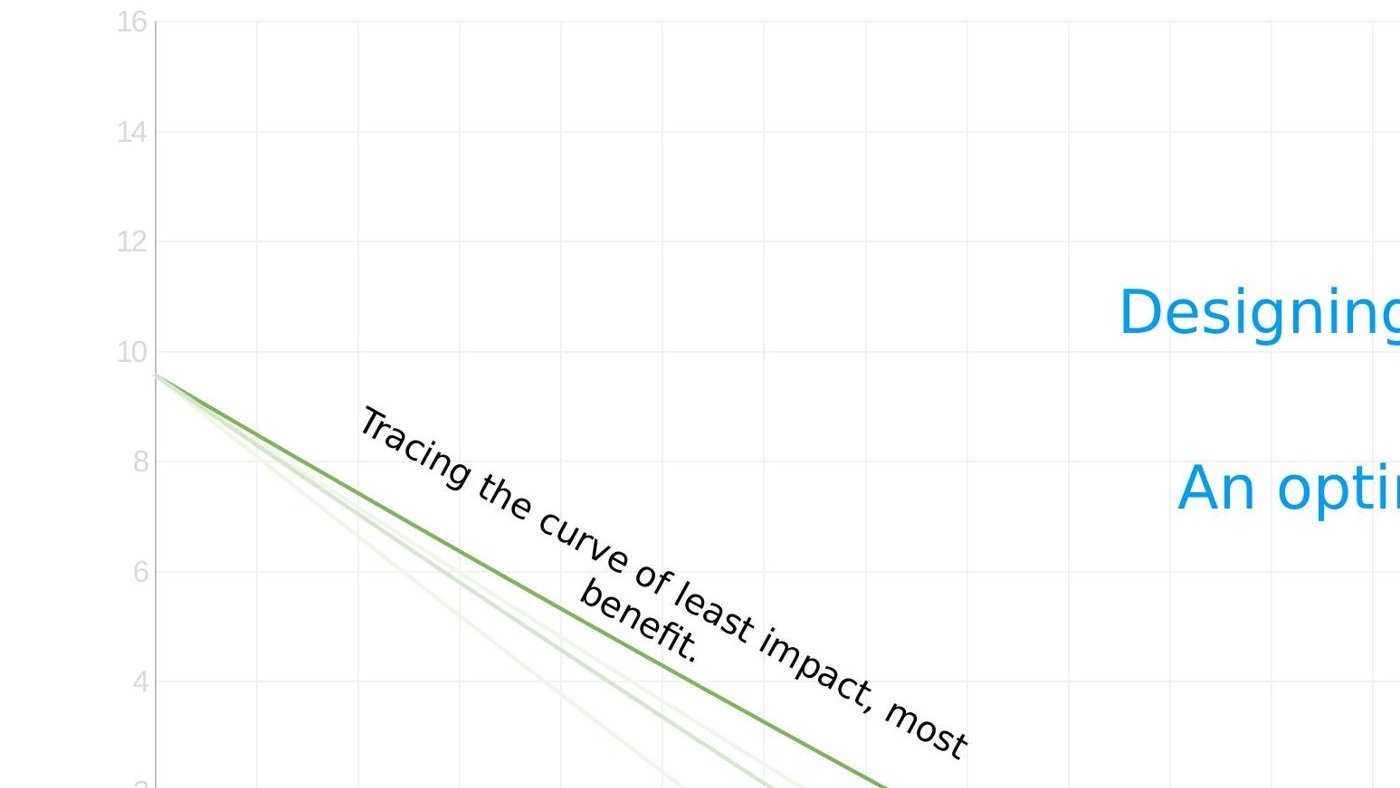
Amaldev Premkumar took the deceptively simple question every façade engineer meets, double glazing or triple?, and used it to show how whole-life carbon turns façade sustainability into an optimisation problem, and why a spreadsheet cannot solve it.
Measuring sustainability in a building is genuinely hard, and the façade is only one part of it. Whether a double-glazed or triple-glazed envelope is the better choice cannot be settled by intuition, it takes a surprising amount of work, Premkumar argued, and the tools most teams reach for are the bottleneck.
The spreadsheet problem
The conventional workflow, Premkumar showed, runs from CAD drawing to a building energy model to visualisation to an embodied-carbon figure, the global warming potential per square metre of façade, assessed in line with the CWCT embodied-carbon methodology. Done in spreadsheets, it trades speed against range: you can go deep on one option slowly, or skim many options, but not both. And the real question, double or triple glazing, is a whole-life one, where a higher embodied-carbon option can win over time by cutting operational carbon.
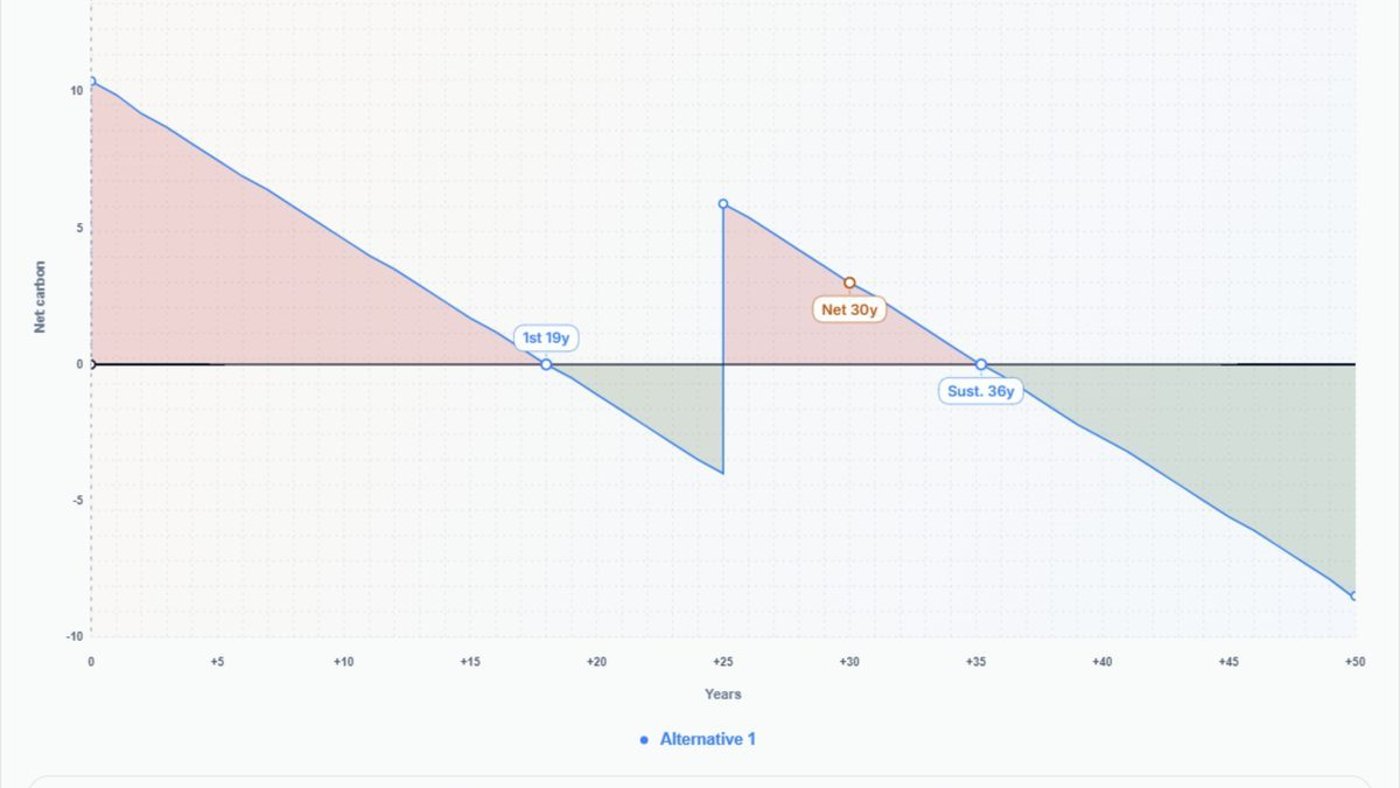
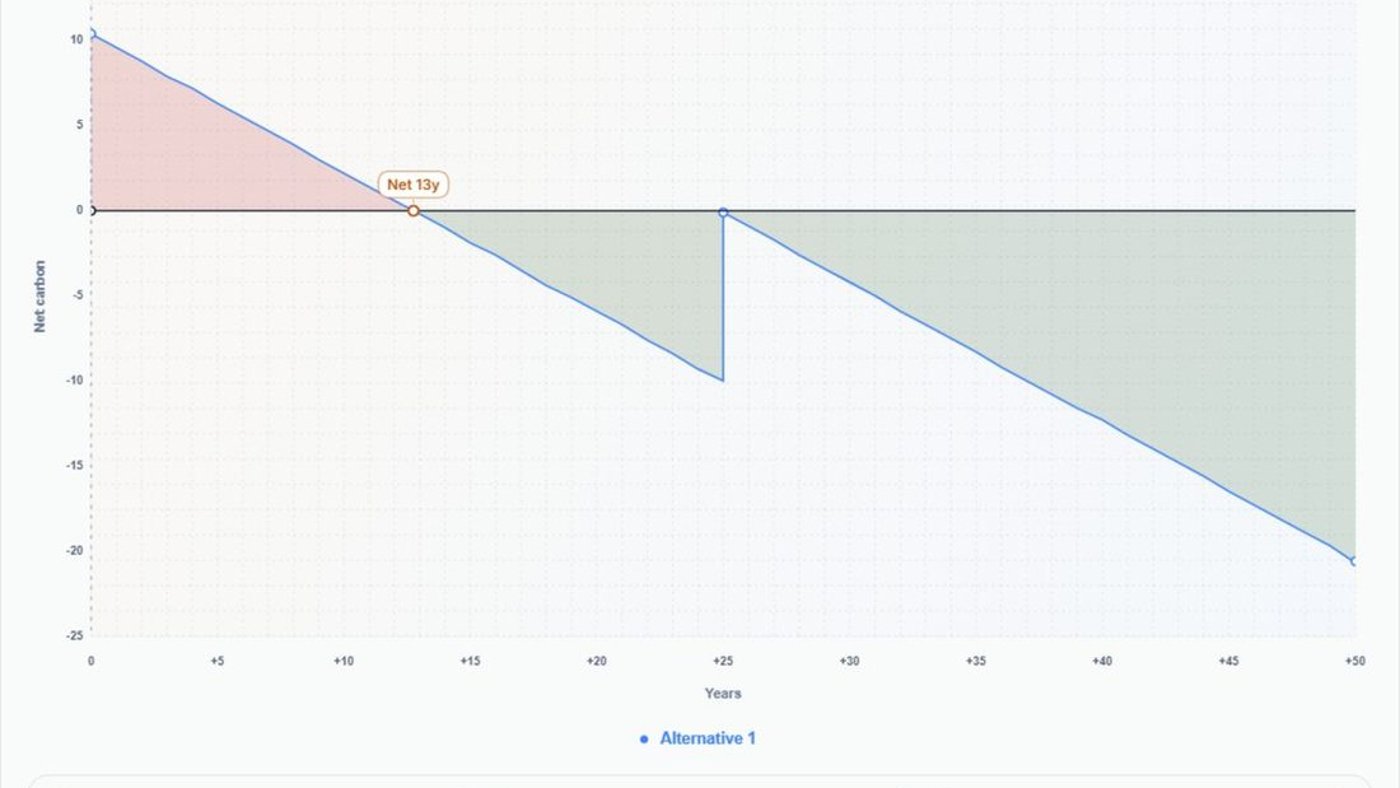
That is the crux of carbon payback. Plot net carbon against years, Premkumar explained, and an option with more embodied carbon starts in "carbon debt" above the baseline, then, if its operational savings are real, crosses below into "carbon saved," with a payback point somewhere in between. Whether triple glazing is worth it is simply a question of where that crossing falls, against the grid's decarbonisation over the building's life.
Building the model
To answer it properly, Ramboll built a whole-building energy model, a commercial building in Oxford, running from inputs to annual loads across passive demands (heating, cooling, lighting, equipment and hot water) and system efficiencies, then plotting the result against every grid-decarbonisation pathway. Behind it sits a carbon-payback calculation that stitches together several databases, a façade database owned by the façade team, a building-physics database and script owned by the building-physics team, an LCA database and a parametric engine, spanning both operational and embodied carbon, and deliberately shared across disciplines rather than siloed.
From spreadsheet to browser
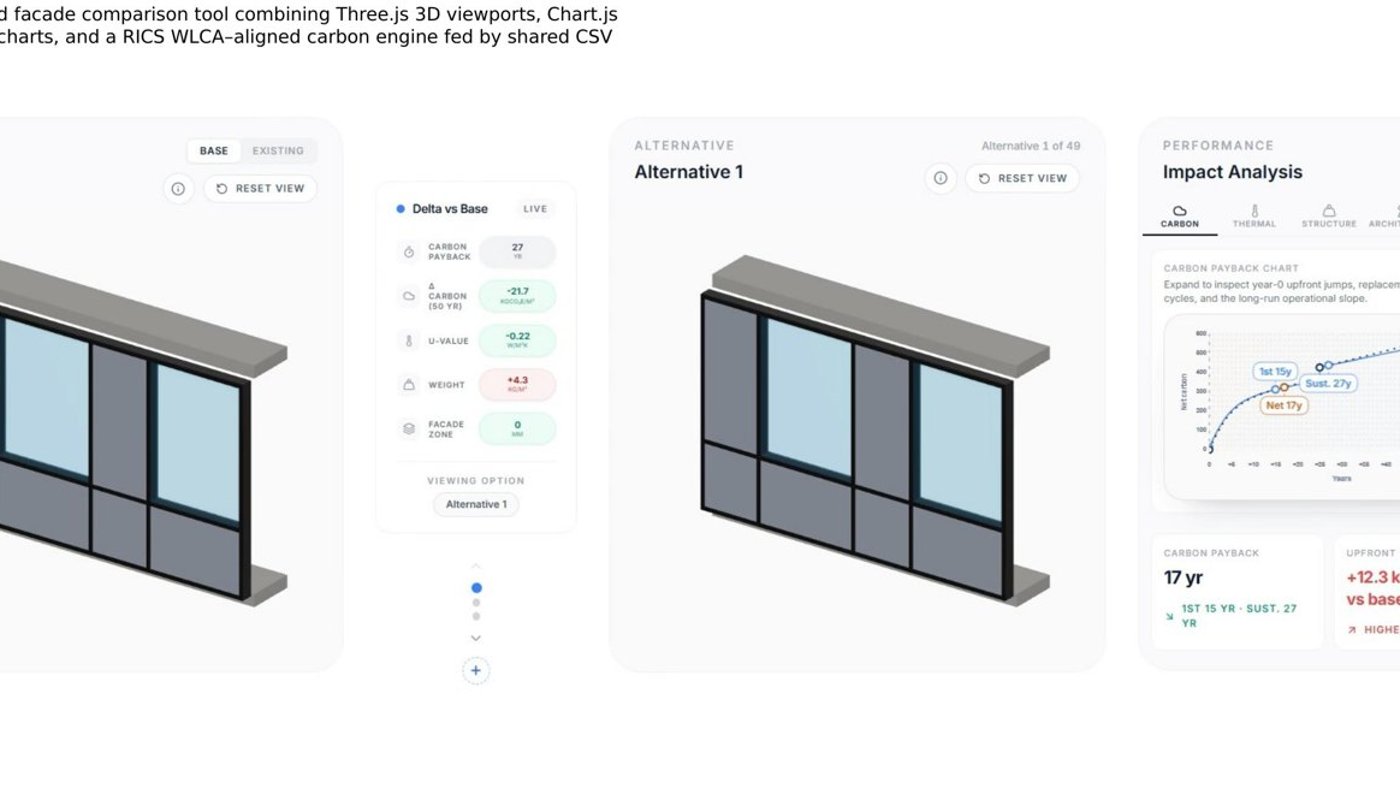
The payoff was the workflow itself. In place of the spreadsheet, Premkumar showed a browser-based façade comparison tool combining Three.js 3D viewports, Chart.js performance charts and a carbon engine aligned to the RICS whole-life-carbon methodology, all fed by shared CSV datasets. Its point is range: one model, run as parallel simulations and interpolated, produced 12,960 data points across 2,160 combinations, six input parameters varied at once, through nine U-value steps, three g-value steps, five air-tightness steps, four window-to-wall-ratio steps and four low-carbon material steps. "Turning the knobs," as he put it, you can watch net carbon move as you drop the glass U-value from 1.0 to 0.6, tighten air-tightness from 5 to 2 m³/hr·m², or swap standard aluminium for recycled, each change plotted as a delta against the baseline.
The framework, he argued, dissolves the usability barriers that make computational methods painful in practice, dependence on specialist software, datasets that go stale and need manual updating, tangled interdependencies, and assumptions that shift as a project moves through stages.
Sustainability as an optimisation problem
Premkumar's framing was the memorable part. Designing for sustainability, he argued, is an optimisation problem, tracing the curve of least impact and most benefit, and the value of a tool that can test thousands of combinations is not just efficiency but insight: it lets you test more, he said, "to reinforce intuition, or to open eyes." Double or triple glazing, in the end, is not a rule of thumb. It is a point on a curve you have to actually plot.