


Ritesh Jindal set out how computational tools are changing façade delivery, from cutting more than 3,000 unique roof panels down to a buildable family of shapes, to platforms that test thousands of options and generate maintenance documentation on their own.
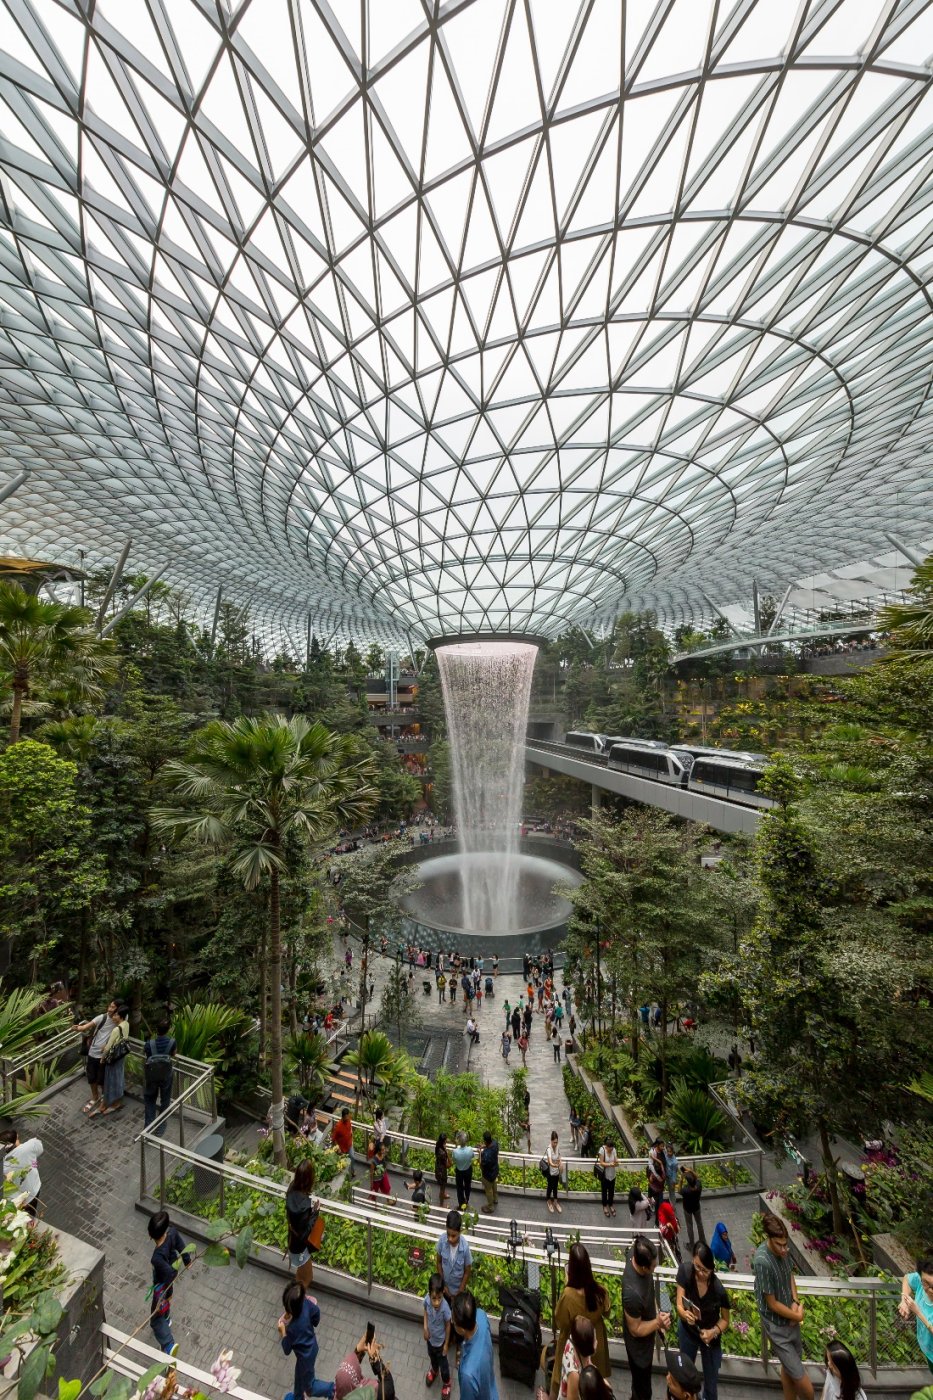
Jindal opened his argument simply: advancement is now happening so quickly that a façade team which does not pick up digital tools risks losing the ability to keep pace at all. His case was not for technology as an end in itself but as the means by which cost pressure and design ambition can be reconciled. Cost, he accepted, is one factor among several, but optimisation should not be allowed to kill the architect's vision. He described a façade group of more than 300 people worldwide, connected through an internal skills network and made up of architects, engineers, building physicists, material specialists and geometry experts, all responding to the same problem from different directions.
Rationalising a roof cloud
The first of his two themes was panel rationalisation, illustrated by a roof cloud sitting on top of a 125-metre-tall building. The architect, Jindal recalled, wanted a purely organic form that would read like a forest, and the first question was simply what the geometry actually was. An initial division into square panels produced more than 3,000 unique pieces, which he characterised as a nightmare for a contractor trying to work out which panel goes where on site. The team moved instead to a triangulated arrangement. The decisive step, he stressed, is setting the parameters or KPIs before any scripting begins; here those were area, height and width.
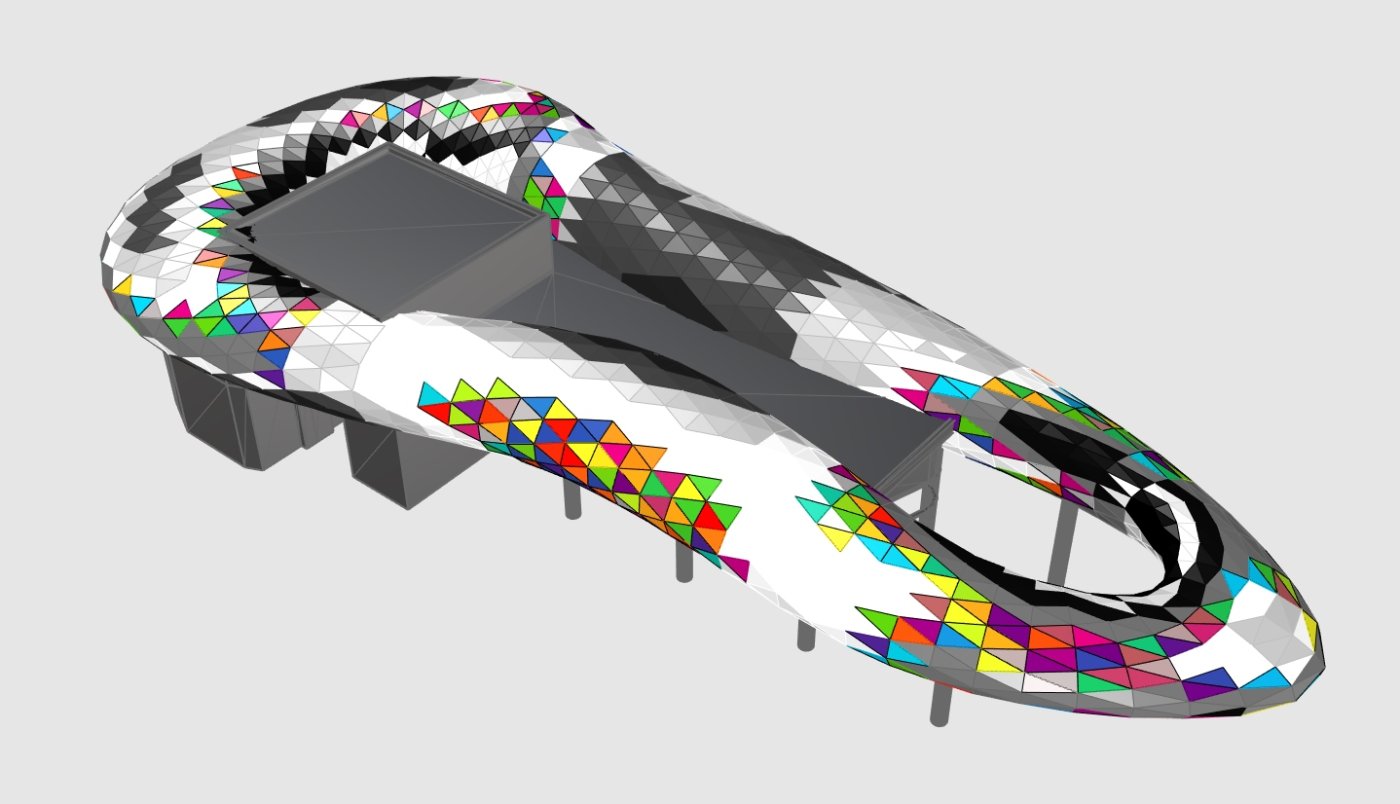
A Grasshopper script was written so that the panels effectively negotiated with each other, with the roof divided into three zones and the automation left to find the most optimised solution within the classifications set for it. Once the script and geometry were in place, testing a change became a matter of a few clicks: if 1,200 was not working, 1,250 could be tried and the consequence seen immediately, with the bulge of the form shifting as the optimisation ran. Several options were presented, each with a different panel count and therefore a different cost. Rationalisation, Jindal noted, has to consider fabrication and installation as much as appearance.
From data to informed decisions
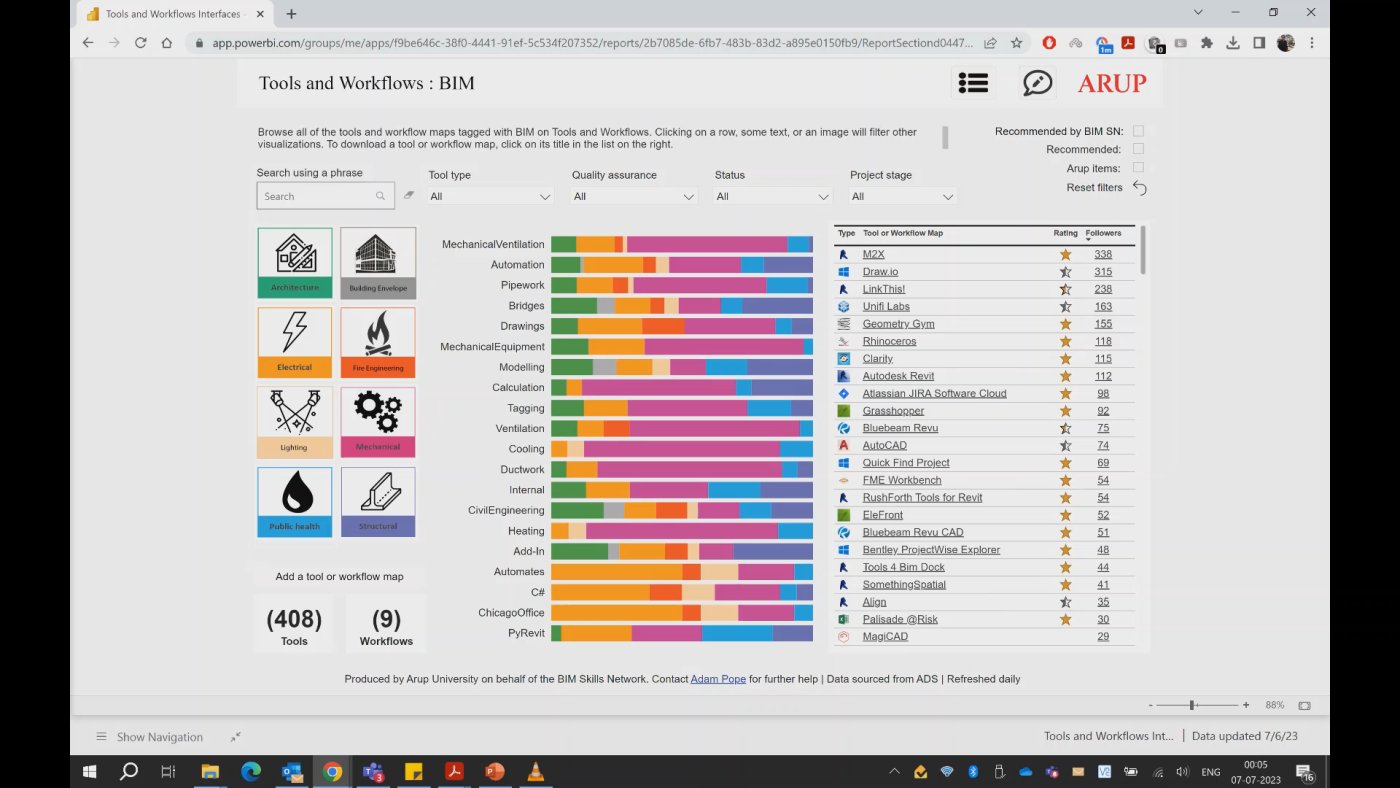
That exercise left the team with a great deal of data, which led Jindal to the familiar progression from discrete facts to structured information, then knowledge, then the wisdom to apply it on the next project. His practice has built more than 2,250 tools of this kind, catalogued on an internal dashboard that can be filtered by discipline, by what the tool does and by the software it plugs into. Someone needing a CFD simulation of escape routes in a fire, for example, can select fire engineering and see which tools apply. He picked three from that library to describe in detail.
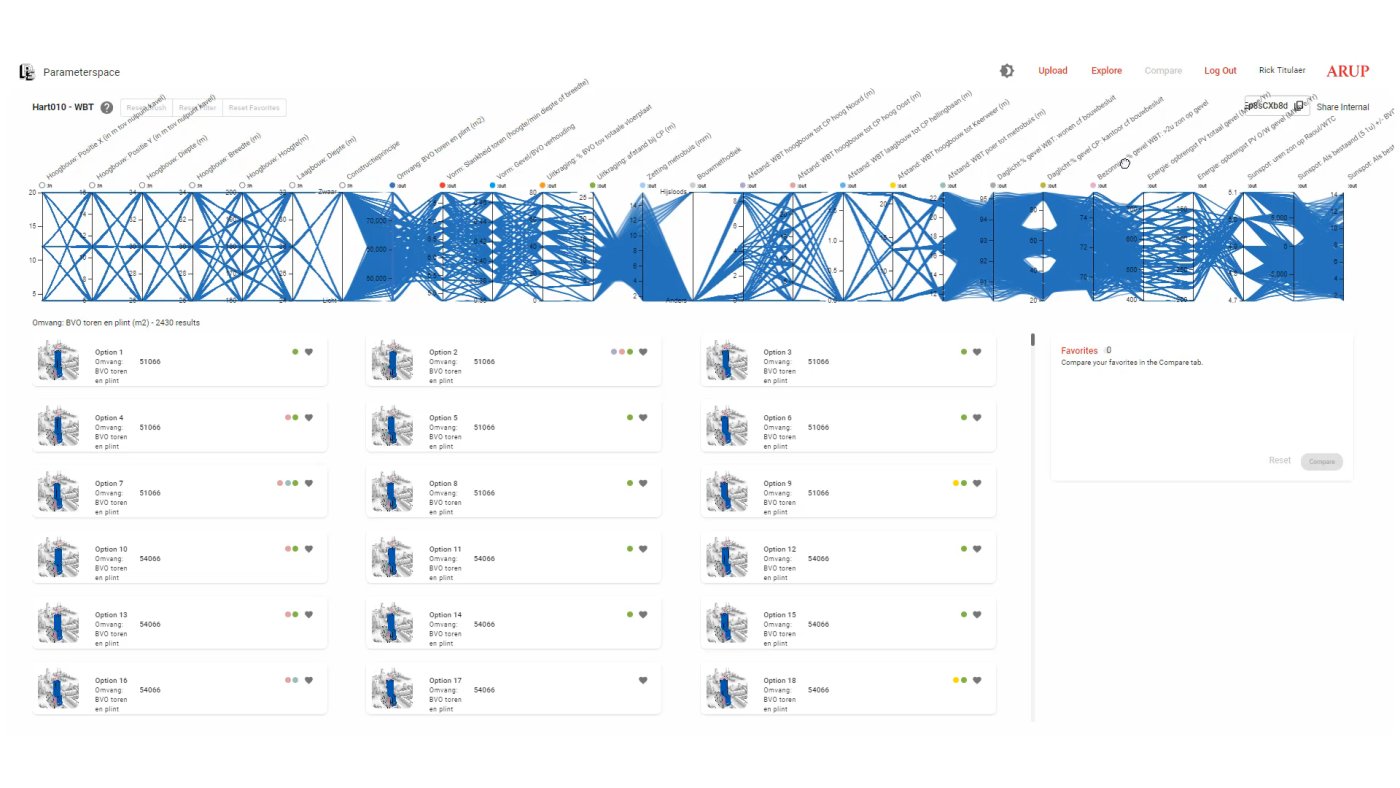
The first, Arup Inform, is a data-driven design platform for working through permutations towards a design that satisfies client, architect and engineer at once. The sequence begins with the design challenge, moves to the KPIs, which might be area, cost, orientation, wind or cooling load, and from there into iteration. On one project the KPIs were gross floor area, sunlight, daylight, settlements, noise and structural wind. The results were plotted so that a single view carried 11,000 options; because the platform is cloud-based, Jindal said, the team and client could sit in one room, agree which parameters mattered most to whom, mark favourites and reach a shortlist in a single meeting. The approach has since been applied to a project in Pune he could not show for confidentiality reasons.
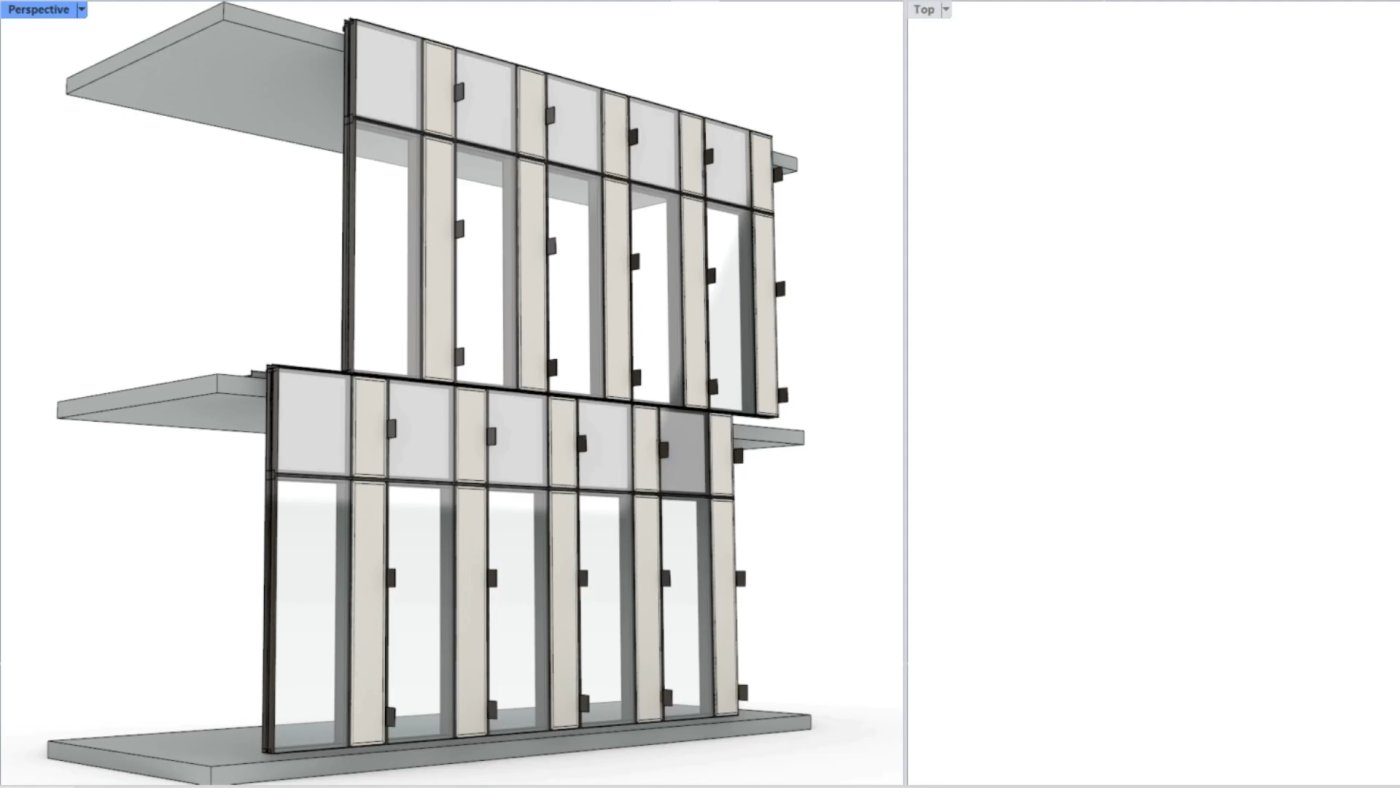
The second, façade canvas, treats the envelope as a blank sheet on which conceptual options can be generated. Mullion depth, the angle of the façade, the distance between panels, panel width and offsets are all editable, and a C# script describes how panels behave as the slab deflects. On a Mumbai project that allowed the façade team, the architect, the client and the structural engineer to agree the permissible deflection between columns in the same conversation, each side then working on its own profiles or scripts. A prototype now links the platform to the practice's own structural software, GSA, so that load cases can be applied and a concept judged workable at the click of a button.
Maintenance planned digitally
The third tackled building maintenance, which Jindal described as a repetitive drawing exercise redone every time the architect issues a new model. His team instead built a digital BMU strategy in which each part of the envelope is colour-coded by how it will be cleaned and maintained over its life cycle. Smaller automation tools then generate sheets, sections and elevations and export a documentation package; go for a coffee, he said, and the drawings are waiting. When the model changes, a clash detection run shows which access system now conflicts with the façade, and the strategy is reissued. The same data supports rent-versus-buy decisions, since cleaning areas, times and costs can be projected over a ten- or fifteen-year horizon.